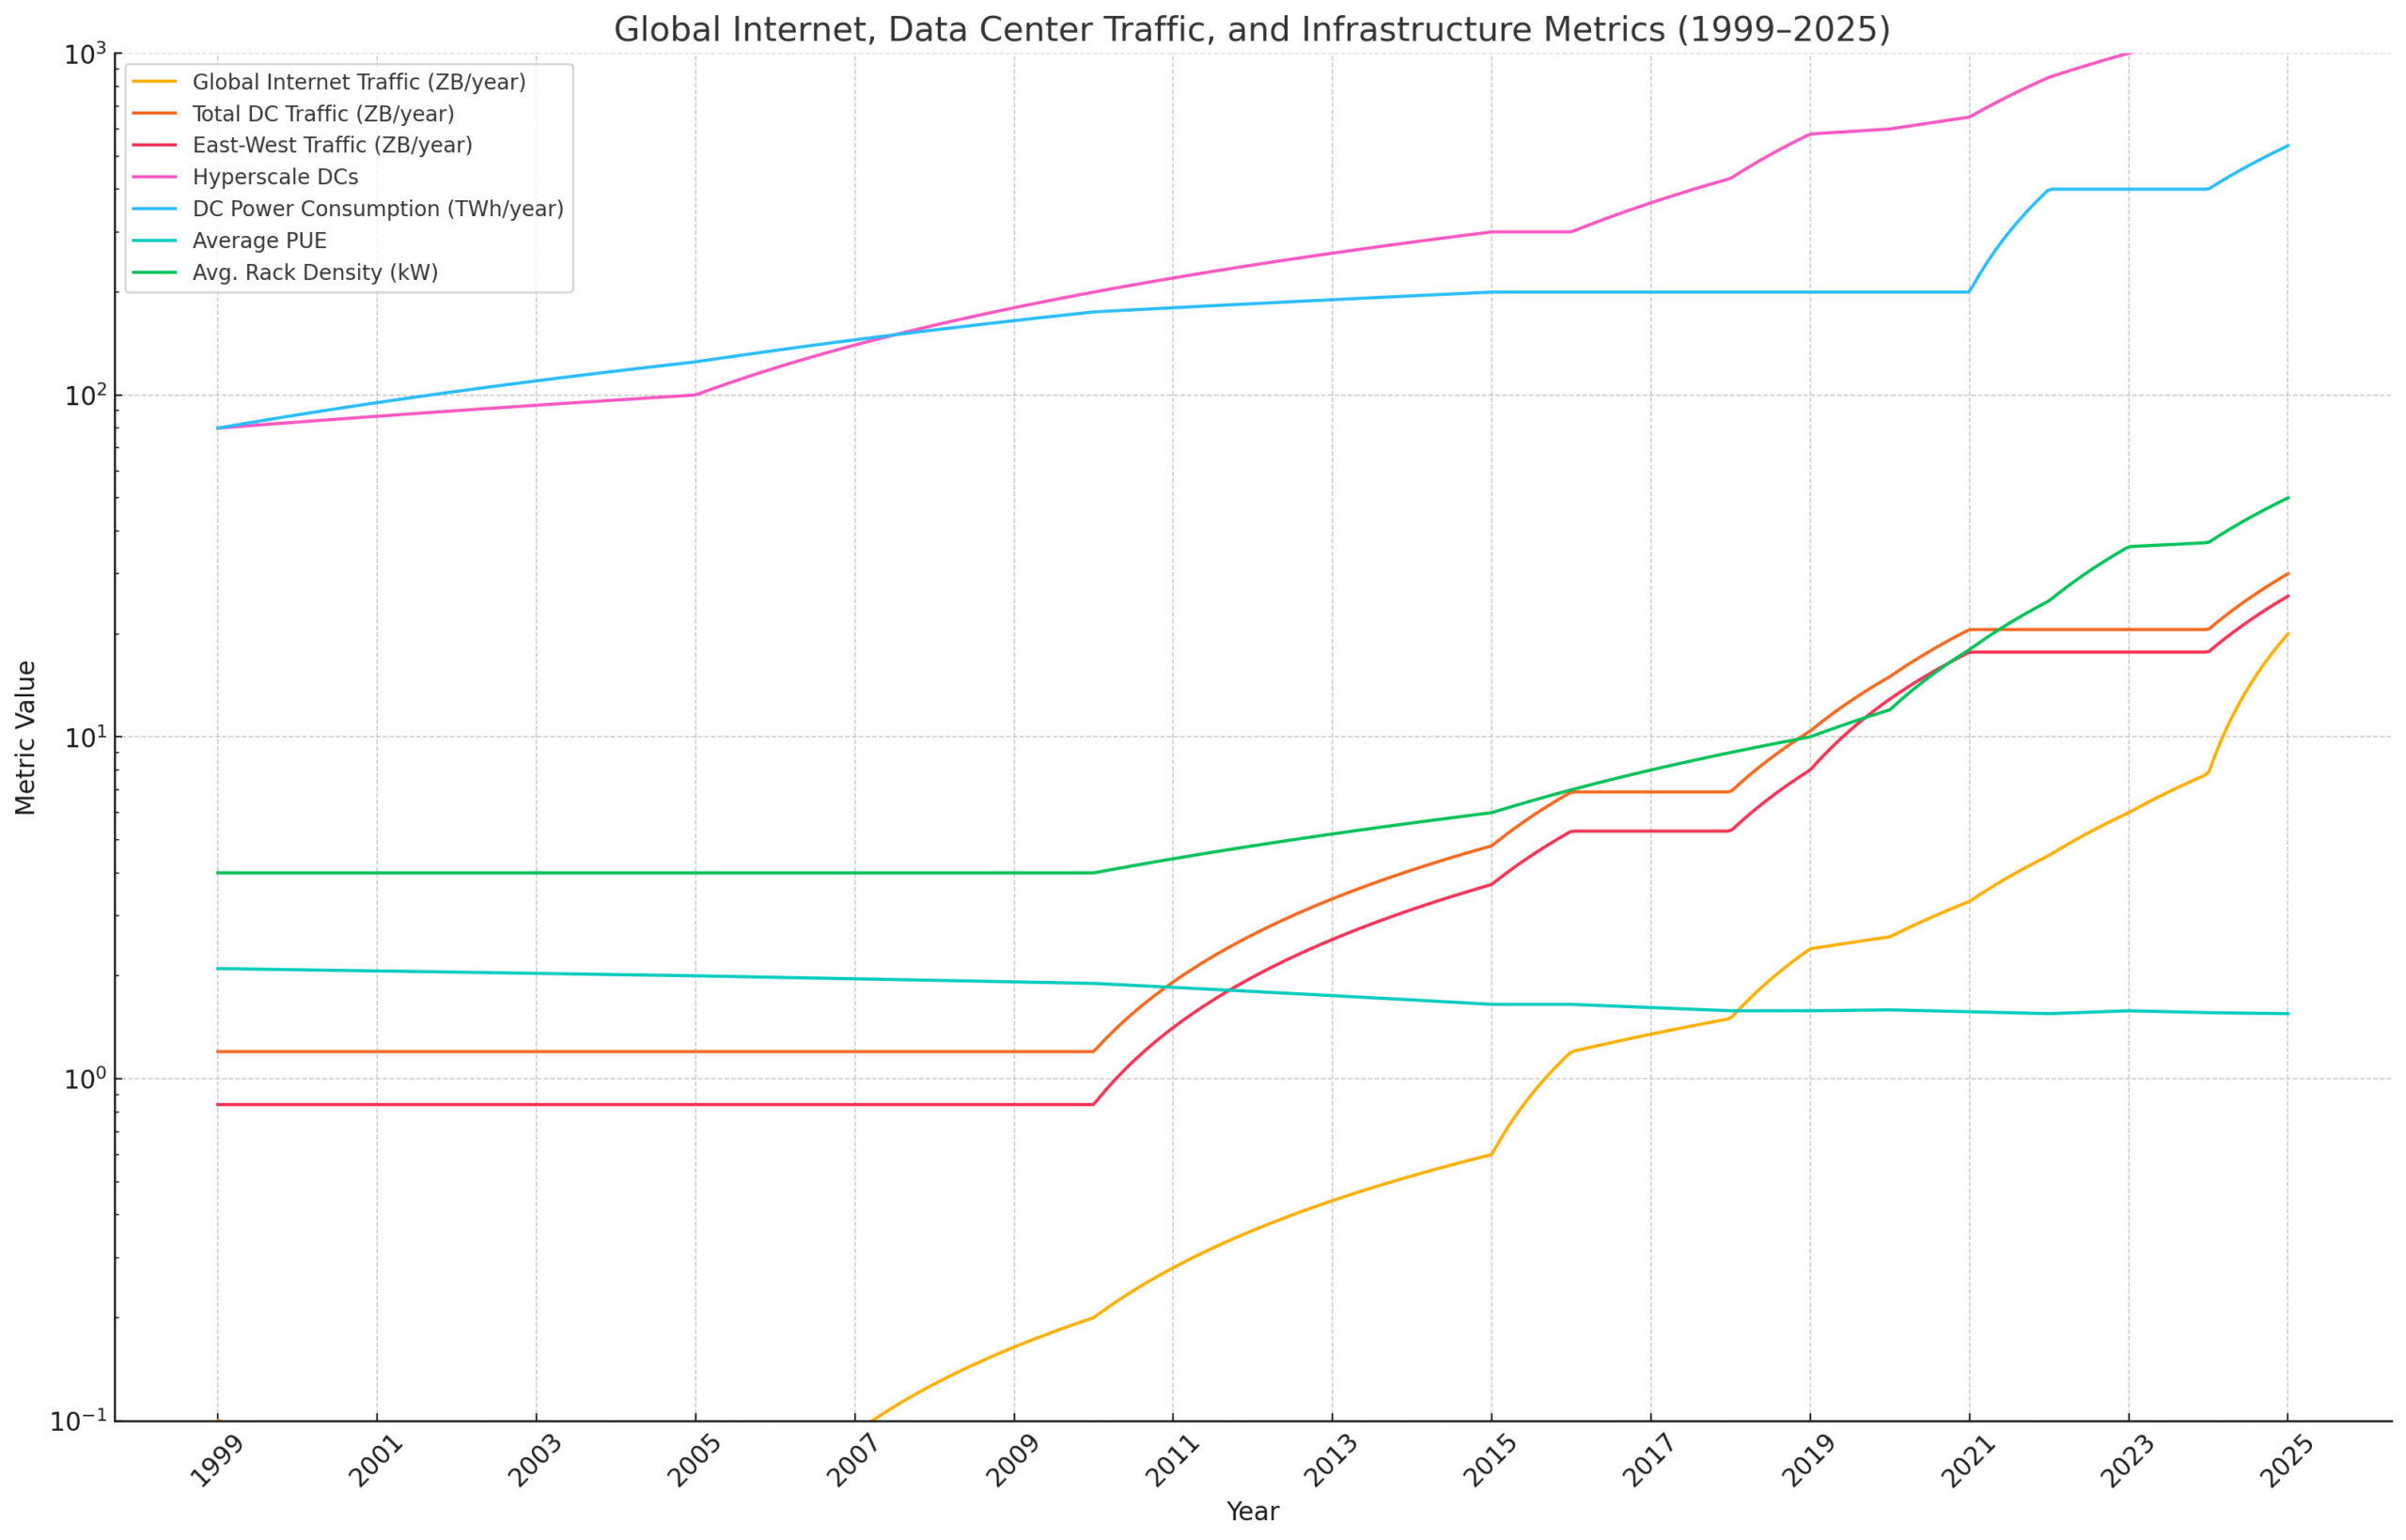
A historical and projected view of global internet and data center traffic, AI trends, power consumption, and other key metrics from 1999 to 2025.
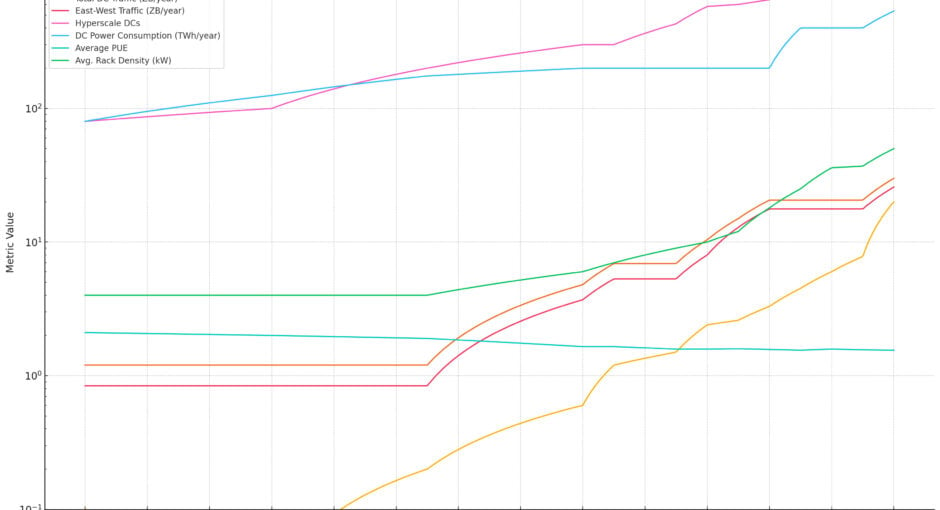
These data underpin the time-series comparisons, showing general intra-DC traffic climbing from ~70 EB/mo in 2010 to ~1000+ EB/mo in 2020, and AI cluster traffic jumping from ~0 to dozens of EB/mo over the same interval, with an inflection in the early 2020s due to generative AI. The charts would illustrate the sharp uptrend in AI-driven traffic versus the sustained growth of baseline east-west traffic, highlighting how new workloads (like LLM training) are reshaping hyperscale network demands.
1999
- Global Internet Traffic: << 0.1 ZB/year
- Total DC Traffic: —
- East-West Traffic: Negligible
- East-West % of Total DC Traffic: —
- AI East-West Traffic: Negligible
- Hyperscale DCs: <100 (Est.)
- DC Power Consumption: Low (<<100 TWh/yr)
- Avg. PUE: High (>2.0)
- Avg. Rack Density: Low (<5 kW)
2005
- Global Internet Traffic: ~0.02 ZB/year
- Total DC Traffic: —
- East-West Traffic: Negligible
- East-West % of Total DC Traffic: —
- AI East-West Traffic: Negligible
- Hyperscale DCs: ~100 (Est.)
- DC Power Consumption: ~100-150 TWh/yr
- Avg. PUE: ~2.0
- Avg. Rack Density: Low (<5 kW)
2010
- Global Internet Traffic: ~0.2 ZB/year
- Total DC Traffic: ~1.2 ZB/year [Cisco]
- East-West Traffic: >0.84 ZB/year [Cisco]
- East-West %: >70% [Cisco]
- AI East-West Traffic: Negligible
- Hyperscale DCs: ~200 (Est.)
- DC Power Consumption: ~150-200 TWh/yr
- Avg. PUE: ~1.8-2.0
- Avg. Rack Density: Low (<5 kW)
2015
- Global Internet Traffic: ~0.6 ZB/year
- Total DC Traffic: ~4.8 ZB/year [Cisco]
- East-West Traffic: ~3.7 ZB/year [Cisco]
- East-West %: ~76% [Cisco]
- AI East-West Traffic: Emerging (PB/month)
- Hyperscale DCs: ~300 (Est.)
- DC Power Consumption: ~200 TWh/yr
- Avg. PUE: ~1.6-1.7
- Avg. Rack Density: ~5-7 kW
2016
- Global Internet Traffic: ~1.2 ZB/year
- Total DC Traffic: ~6.9 ZB/year (Cisco VNI)
- East-West Traffic: ~5.3 ZB/year (≈76%)
- East-West %: ~76%
- AI East-West Traffic: Growing
- Hyperscale DCs: ~300
- DC Power Consumption: –
- Avg. PUE: ~1.65
- Avg. Rack Density: ~5-8 kW
2018
- Global Internet Traffic: ~1.5 ZB/year
- Total DC Traffic: —
- East-West Traffic: —
- East-West %: —
- AI East-West Traffic: Ramping Up
- Hyperscale DCs: ~430
- DC Power Consumption: –
- Avg. PUE: ~1.58
- Avg. Rack Density: ~8-10 kW
2019
- Global Internet Traffic: ~2.4 ZB/year (Est. from CAGR)
- Total DC Traffic: ~10.4 ZB/year [datacenterknowledge.com]
- East-West Traffic: ~8.0 ZB/year (≈77%)
- East-West %: ~77%
- AI East-West Traffic: Sharp Inflection
- Hyperscale DCs: <600
- DC Power Consumption: –
- Avg. PUE: ~1.58
- Avg. Rack Density: ~10 kW
2020
- Global Internet Traffic: ~2.6 ZB/year
- Total DC Traffic: ~15 ZB/year [Cisco]
- East-West Traffic: ~12.9 ZB/year [Cisco]
- East-West %: ~86% [Cisco]
- AI East-West Traffic: Hundreds PB/month
- Hyperscale DCs: <600
- DC Power Consumption: –
- Avg. PUE: ~1.59
- Avg. Rack Density: ~10-15 kW
2021
- Global Internet Traffic: ~3.3 ZB/year
- Total DC Traffic: ~20.6 ZB/year (Cisco VNI)
- East-West Traffic: ~17.7 ZB/year (≈86%)
- East-West %: ~86%
- AI East-West Traffic: Explosive Growth
- Hyperscale DCs: —
- DC Power Consumption: –
- Avg. PUE: ~1.57
- Avg. Rack Density: ~15-20 kW
2022
- Global Internet Traffic: 4.2 – 4.7 ZB/year
- Total DC Traffic: —
- East-West Traffic: —
- East-West %: —
- AI East-West Traffic: Explosive Growth
- Hyperscale DCs: >800
- DC Power Consumption: ~400 TWh/yr (Midpoint)
- Avg. PUE: ~1.55
- Avg. Rack Density: ~20-30 kW
2023
- Global Internet Traffic: ~6.0 ZB/year (Est. from CAGR)
- Total DC Traffic: —
- East-West Traffic: —
- East-West %: —
- AI East-West Traffic: Explosive Growth (EB/month)
- Hyperscale DCs: >1,000
- DC Power Consumption: –
- Avg. PUE: ~1.58
- Avg. Rack Density: ~36 kW (Avg.)
2024
- Global Internet Traffic: ~7.8 ZB/year (Est. from CAGR)
- Total DC Traffic: —
- East-West Traffic: —
- East-West %: —
- AI East-West Traffic: Primary Driver
- Hyperscale DCs: ~1,136
- DC Power Consumption: –
- Avg. PUE: ~1.56
- Avg. Rack Density: >36 kW
2025E
- Global Internet Traffic: ~9.6 – 30+ ZB/year (Est.)
- Total DC Traffic: 30+ ZB/year [Cisco]
- East-West Traffic: >86% (Est.)
- East-West %: >86% (Est.)
- AI East-West Traffic: Primary Driver (ZB/year)
- Hyperscale DCs: >1200 (Est.)
- DC Power Consumption: ~536 TWh/yr (Est.)
- Avg. PUE: ~1.55 (Est.)
- Avg. Rack Density: ~50 kW (Proj.)
Sources: Internal traffic proportions and volumes from Cisco’s Global Cloud Index and othersnewsroom.cisco.com
hyperscaler network scaling from Google
cloud.google.com and Meta
AI cluster specs from Microsoft, Meta, NVIDIA, and Delloro analyses


Social Profiles